Allocation vs Utilization: Put Your Data in Action With Workplace Analytics!
If you’re a facility manager or otherwise deal with the business of organizing your office’s space, there are two terms you need to be familiar with: allocation and utilization. These terms are often used interchangeably, but they actually refer to very specific yet equally important aspects of creating a cost-effective and space-efficient workplace environment. Learning the difference between allocation and utilization is crucial when describing actionable metrics that translate to a better, more agile use of space.
What Is Allocation?
When referring to allocation vs. utilization in a business setting, “allocation” refers to the number of assigned desks and workspaces vs unassigned ones. For example, the allocation rate in a given department that has 100 desks with 80 assigned is considered 80% allocated. It’s generally considered that an allocation rate below 95%-100% is poor, as any fully equipped workstation with no one using it is an observable wasted space.
Allocation shouldn’t be confused for “density,” which takes square footage into consideration in its relationship to utilization. To find the rate of density of your workplace, divide occupied floor space by the total floor space (leave out areas like bathrooms or breakrooms, which technically don’t count as workable space.)
For example, a company with 10 employees which occupy workstations that are 80 square feet uses 800 square feet of space. In an office with a usable square footage of 2000 square feet, the density would be 40%. As the pre-pandemic average density rate is somewhere between 50-60%, this office would be considered to have low density. Similarly, density can be measured based on capacity. If an 8-person conference room is in use by 3 people, its density rate is 37.5%.
What Is Utilization?
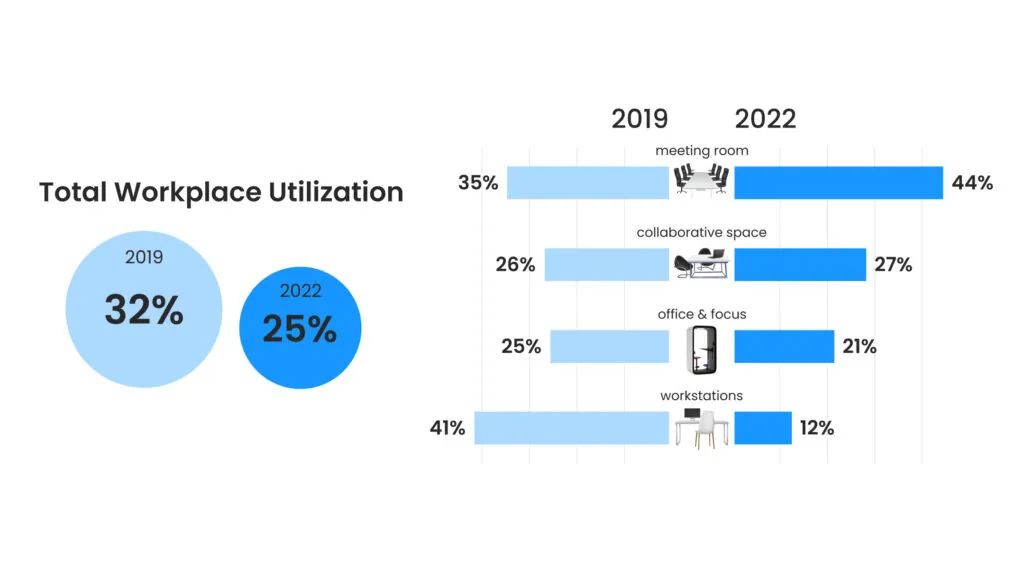
Utilization describes the rate at which employees use a given space over a period of time. Time is the key dimension here. While occupancy is static, such as measuring how many employees are at their desks at this moment, utilization is dynamic, like tracking how many people use a specific meeting room over the course of a month.
Utilization can be comprised of many different workplace utilization metrics, but a good example is to measure time-in-use. An example of this includes a conference room that is available for 8 hours per day but is only used for 4 and will have a utilization rate of 50%. Further, taking capacity in to consideration, if the 8-person room is only used by 2 people on average for those 4 hours, the utilization rate drops to 12.5%
What Is the Difference Between Allocation and Utilization?
While closely related, the differences between these two metrics are necessary to give a complete picture of how space is used in the workplace. The difference between allocation vs. utilization comes down to how much of your workspace is in use and how that space is being used. Allocation is generally a lower resolution metric when compared to sensor-based utilization. Optimization, or the process of balancing allocation with efficient utilization, is a difficult task that requires managers to understand both metrics. When starting from an established workspace utilization and allocation benchmark, it becomes easier to recognize inefficiencies and bottlenecks and make tangible changes.
For example: During the pandemic, many companies adopted staggered work schedules and modern office designs and found that even though the number of allocated workers remained the same, the utilization rate increased because of their programming. Insights like this can justify the idea of downsizing, saving the company money on costly real estate with little impact on productivity.
Other Metrics Not to Be Confused With Allocation and Utilization
Speaking of which, there are a few other terms closely related to the difference between allocation and utilization, but they mean different things in a work setting.
“Productivity” to many managers is measured by quarterly or year-end profits as the most important metric, but this term also incorporates your workforce’s ability to create products, meet goals in a timely manner, and avoid inefficiencies that result in lost profit. Productivity is affected by many variables, from the level of job satisfaction to company culture to even office-related things like office temperature or layout.
“Conformance” refers to how well your workforce is meeting the standards ascribed by management. Managers striving for high conformance among their employees must balance proper incentives and penalties but also need to set realistic expectations for the standards they are trying to impose based on the resources available.
How to Measure Allocation and Utilization
Actionable allocation and utilization metrics come from accurate workplace analytics. Simply put, facility managers and supervisors need data to accurately depict how employees move within and use a workspace, and there are multiple ways to collect it. Workplace analytics metrics for space optimization can come from RFID badges, sign-in sheets, cameras, and password systems, but methods like these often produce flat data sets at the expense of making your employees feel overly policed or even spied on.
Instead, companies have begun investing in smart IoT technology like R-Zero’s occupancy sensors, which can discreetly monitor individual workstations or even take an accurate headcount of entire rooms—while producing no personally identifiable information about your workforce. Sensor data collection creates nuanced, dynamic data sets, telling managers, for example, not just when people arrive at their desks but which hallways or foot traffic patterns are most used to get there. This means that data analytics for workplace occupancy and utilization can be leveraged to pinpoint bottlenecks throughout the office, create a custom heating and cooling schedules to conserve utility energy, or help create optimized, disinfection plans during flu season.
R-Zero’s suite of anonymous occupancy sensors can provide accurate and actionable allocation and utilization data, resulting in significant savings for companies ready to pursue data-driven space solutions.
More posts you might like
-

2022 Benchmark Data. Who Is Measuring What?
Hello Friends, Who ended 2022 where you thought you would? Well, many of our customers did not and some ended the year finding themselves in the middle of surprising new trends. We’d like to share with you some of our 2022 sensor-based Utilization Benchmark Data. If you are curious about any of these key findings, […]
-

Right-Sizing your Portfolio with Peak Metrics
A new way of working is here to stay. What started as a pandemic-era necessity has rapidly become the norm in many industries, including many fortune 500 companies and global corporations. Studies have shown that 73% percent of employees say they need a better reason to go into the office than just company expectations. It’s […]
-
Top 8 Essential Office Space Utilization Metrics & Their Applications
One thing we know for sure is that the future is uncertain. Instead of being stuck in a daze of wonder, real estate professionals are grounding their planning processes in data. So long as they have data to guide them, they can plan for hybrid work environments that are bound to change over time. Fortune […]