Top 8 Essential Office Space Utilization Metrics & Their Applications
One thing we know for sure is that the future is uncertain. Instead of being stuck in a daze of wonder, real estate professionals are grounding their planning processes in data. So long as they have data to guide them, they can plan for hybrid work environments that are bound to change over time. Fortune 500 companies like Apple, Google, and Microsoft have even begun offering hybrid and work-from-home scheduling in perpetuity, but America’s new work reality has presented another challenge to solve: making existing workspaces as efficient and cost-effective as possible. With commercial real estate prices high and vacancies at an estimated 1.34 million square feet more than what was leased in Q3 of 2022, the pressure to justify expenditure and maximize investment is mounting. Accurate space utilization metrics can provide an actionable method of accounting for how space is used and provide solutions for both decreasing cost and increasing productivity.
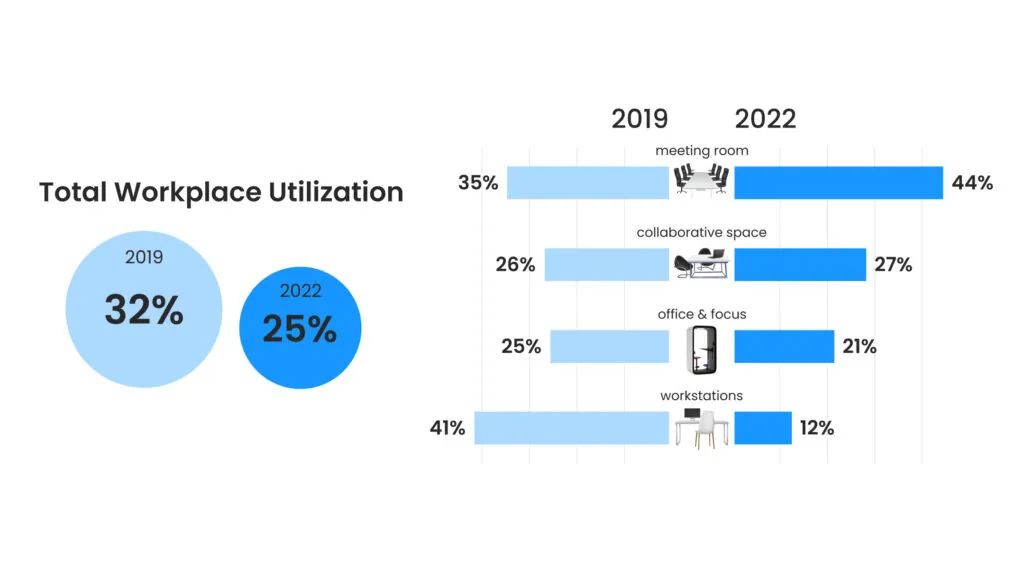
What Is Workplace Utilization?
The definition of workplace utilization has changed over the years. Originally, the only utilization metric companies had access to was the cost per square foot, meaning that a business could either upsize or downsize according to its spatial needs and budget. The old method of measuring utilization involved dividing the total usable square footage of a workspace by the number of people using that space. This makes for a limiting office space utilization benchmark as it doesn’t provide any actionable variables for cost-effectiveness other than simply increasing or decreasing the amount of space each employee has access to—something that can drastically affect an employee’s job satisfaction. In these cases, managers trying to save costs on real estate may end up losing revenue in impacted employee efficiency.
Modern space utilization metrics take a more nuanced approach, incorporating all cost values, workspace reservations, occupancy patterns by space type, etc., to come up with a cost-per-vacancy approach intended to yield maximum ROI on existing space. This effort always maintains an eye on positively impacting employee performance. By prioritizing workspace efficiency over square-footage costs, employers and managers are left with agile workplaces capable of accommodating hybrid scheduling, responding to volatile real estate markets, and maintaining company culture.
Office Space Utilization Metrics Terms
Getting a handle on modern office space utilization metrics requires space planners to be familiar with some key points. When properly understood, these terms can be applied to find new workplace utilization insights and improve office space efficiency.
1. Capacity vs Occupancy
“Capacity” refers to the number of people who can occupy a space, while “Occupancy” refers to how many people actually use that space at a given time. This distinction provides the most basic of office space utilization analysis in terms of how much of the space you’re paying for is actually being used and is a good stepping stone for in-depth insights.
2. Average Peak Utilization
Actual utilization starts to come into play when looking at the distinction between occupancy and capacity and adding the variable of time. In this instance, you can measure your occupancy rate against the max capacity of a space (whether that’s a single desk, conference room, office floor, or the entire building) at different times of the day to see when that space is most in use. By tracking these occupancy trends, you can find the Average Peak Utilization, or what time and for how long that space is occupied. Once you’ve established the APU, you can start to explore the patterns that contribute to higher occupancy for that space within the context of what else is happening in the office. Pairing this data with room reservation data may reveal trends on collaboration and how to load balance room demand.
3. Cost Per Person
The real estate Cost Per Person model of utilization refers to determining how much it costs for one person to perform their duties at maximum efficiency regarding space. Establishing the CPP can then be used to address inefficiencies in desk arrangements, multi-use rooms, foot traffic, scheduling, etc. CPP requires intricate data points to accurately establish and often benefits from the collection of real-time data.
4. Density
Density is a baselinespace utilization metrics and refers to the measurement of square footage allocated per employee. Density is usually measured in percentage and can be calculated by dividing the square footage of usable office space by the number of employees. It’s often thought that increasing density is the quickest way to maximize ROI on real estate, but there’s a tipping point where employees who feel too crowded can lose efficiency and job satisfaction, leading to lost revenue and high turnover. Alternatively, low density may result in poor employee satisfaction as the office may feel empty. Pinpointing a density that results in the magic “office buzz” is crucial to effective workspace utilization.
5. Trending Spaces
Trending Spaces is a space utilization metric that works hand-in-hand with APU. While APU refers to the point of the day, week, or month when a space reaches peak occupancy, popularity refers to the general trend of how often a space is used compared to others. For example, if your office has a conference room that reaches 80% occupancy every Wednesday afternoon but is vacant most of the rest of the week and a meeting area that sees a 50% occupancy rate every day, it can be said that the later meeting area has a higher popularity.
6. All-In Utilization Rate
This term is something you might see in the literature about utilization, and it is used by the U.S. General Services Administration to simply refer to the total usable square footage divided by the number of personnel. It is the simplest and most straightforward method of calculating utilization.
7. Vacancy Rate
The Vacancy Rate refers to the percentage of allotted employee workspaces that are unused at a given time. The vacancy rate is an important factor as space that is allotted yet unused works against the optimization of a workspace. For example, if a company has 10 workspaces allotted, but only 8 are in use, the vacancy rate for that space is 20%—space that is effectively wasted as companies still have to pay for it even though there is no one using it.
8. Dwell Time
This is a utilization metric that calculates the duration by which a space is occupied on average. This may vary from space to space and is an important indicator of how workers use each space that is available to them. For example, a conference room that is used for 2 hours every day, except for Fridays when it is used for 4 hours, would have an overall dwell time of 2.4 hours per week. This data can usually only be reliably collected through smart sensors or other technology that can aggregate the amount of time in which a space is in use.
Benefits of Brand New Office Space Utilization Metrics
Modern space utilization metrics provide companies with the granularity and confidence to adjust to changing workplace culture and leave behind stale paradigms about how and when people use office space. Physical workspace is known to be the second largest investment a company makes behind employees, but until recent years, the data that justifies important decisions like upsizing, scheduling, or office layouts have been rudimentary. With detailed utilization metrics, business owners, space planners, and workplace strategists can have granular insights into the nuance that impacts worker behavior while working towards additive goals like utility efficiency, carbon goals, acoustics, etc. Holistic workplace insights are valuable to executives, shareholders, and employees alike.
Gathering the workplace data necessary for these kinds of analyses requires investment in smart technologies. R-Zero’s people counting sensors and occupancy sensors accurately measure when and for how long a person or group of people use a space and stream that data in real-time to the cloud allowing for unprecedented insight into occupancy trends. And because of R-Zero’s privacy-by-design principles, the thermal sensors never create any personally identifying information that could compromise your employees’ right to privacy.
Businesses have begun to take hold of the new reality that change is constant. Utilization tracking is one marker for measuring change over time and adjusting to it as new patterns emerge. All of this effort allows them to build smarter, more agile workplaces that better serve their employees and bottom line.
More posts you might like
-

2022 Benchmark Data. Who Is Measuring What?
Hello Friends, Who ended 2022 where you thought you would? Well, many of our customers did not and some ended the year finding themselves in the middle of surprising new trends. We’d like to share with you some of our 2022 sensor-based Utilization Benchmark Data. If you are curious about any of these key findings, […]
-

Right-Sizing your Portfolio with Peak Metrics
A new way of working is here to stay. What started as a pandemic-era necessity has rapidly become the norm in many industries, including many fortune 500 companies and global corporations. Studies have shown that 73% percent of employees say they need a better reason to go into the office than just company expectations. It’s […]
-
Allocation vs Utilization: Put Your Data in Action With Workplace Analytics!
If you’re a facility manager or otherwise deal with the business of organizing your office’s space, there are two terms you need to be familiar with: allocation and utilization. These terms are often used interchangeably, but they actually refer to very specific yet equally important aspects of creating a cost-effective and space-efficient workplace environment. Learning […]