How Using Workplace Data can Decrease Janitorial Expenses for Your Business
While North American companies are depending on summertime heat to quell the virus and usher in the commencement of business, experts believe that this virus may be here to stay, returning each fall and winter, as an endemic seasonal concern.
We all know that lockdown can’t go on forever, yet to ensure the safety and compliance of workplaces in an uncertain future, we need to usher in a sustainable new normal for our businesses.
We get it, operational cost-cutting couldn’t be more imperative than it is during this time of market decline, and the idea of ramping up the integrity of workplace sanitation to keep the curve flattened just seems like another costly undertaking… but it doesn’t have to be.
Armed with R-Zeros daily office utilization data, you’ll learn how facilities teams can reduce cost, save money on cleaning supplies and still rise up to meet the challenge of ‘seasonal’ Covid-19 risk in your workplace; all with the help of accurate workplace data.
Business Cleaning Expenses and Covid-19: What to Expect
The average costs for standard business cleaning services range from 7 to 15 cents per square foot. In an office with 10k SF floor-plates per level, that adds up to $700-1500 per level, per day.
Large businesses of say, 10 levels already fork out millions of dollars per year to maintain even the most basic level of sanitation in their facilities.
In an effort to reduce operating costs, businesses tend to opt for minimal sanitation checklists, but in light of the current situation and necessary emphasis on standard cleaning procedures, you may be concerned that your housekeeping costs per square foot are about to go through the roof.
The truth is, many cleaning crews lack the technology and tools required to address the coronavirus challenge, and yes, those that do tend to come at a much higher price point. This is the case, currently, but there’s some good news on the horizon.
Given that it’s neither viable for most large organizations to hire biological threat specialists on an ongoing basis, nor ethical for companies to lay off cleaning crews of 20-100 workers at a time, groups like the Global BioRisk Advisory Council are coming up with scalable solutions.
The GBAC and similar organizations will offer certification in bio-response fundamentals, so your own cleaning crew can equip themselves with what it takes to combat this risk, which may well become a long-term concern.
Risk-appropriate Cleaning Regimens: What it Takes to Stay Safe
Based on a report from ZipRecruiter, the demand for cleaning services has already skyrocketed to 75% above the March average, and with the required intensification of sanitation regimens, we’re expecting a considerable uptick in cost for this new standard in sanitation.
Given that this virus is believed to survive at least 24 hours on work-surfaces like plastic and metal desktops, additional daily wipe downs with alcohol-based products will be required to supplement the standard cleaning regimen. Corners can no longer be cut on cleaning products and thoroughness in high-use areas.
Now, considering the cost implications of thoroughly cleaning every surface in your building on a daily basis may seem like a bit of a nightmare, but we’re here to offer ways to improve cost efficiency and cost-saving in janitorial services at a time when it’s sorely needed.
Luckily, cost-cutting measures in office spaces with abundant square footage can still prove efficient even in times when a higher level of sanitation is necessary. The key, as we will show you, is understanding what the hidden costs of workplace sanitation really are, and how to reduce operating cost by applying workspace utilization data to your janitorial process.
Uncovering the Hidden Costs of Workplace Sanitation and Cleaning
If you ever pay an after-hours visit to your workplace, then chances are you’ll find cleaning crews hard at work in spaces that saw zero use that day. In fact, cleaning crews tend to apply a standard office checklist, that may include consecutive cleans in rooms that saw no usage between this clean and the last.
Cleaning procedures for most company complexes are low-tech, low-res affairs, with little mind paid to how areas were really used throughout the day. In large complexes, with extensive checklists of rooms, floors, and desks, we regularly find an inefficient deployment of resources and only the standard level of sanitation, regardless of how high the utilization.
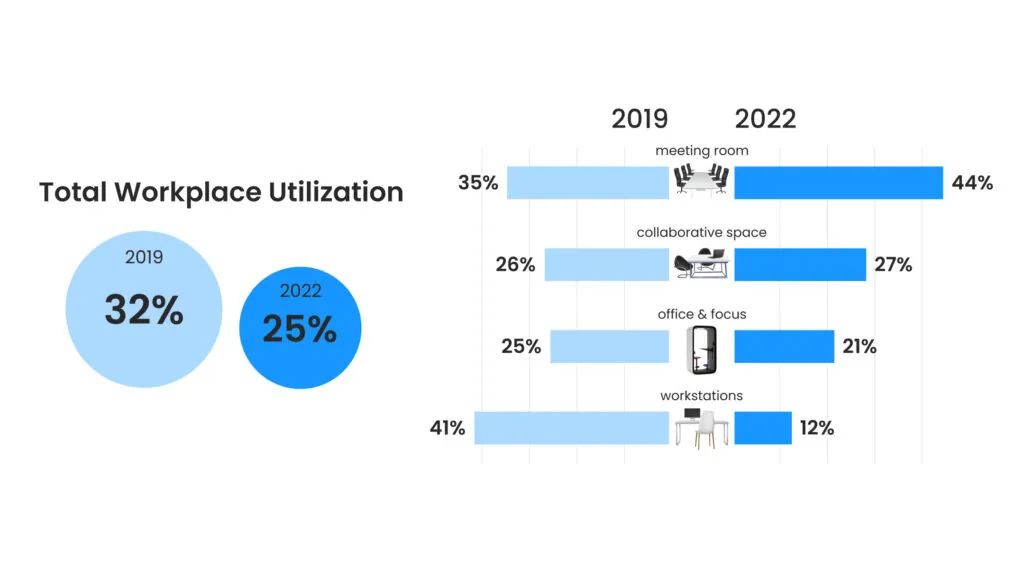
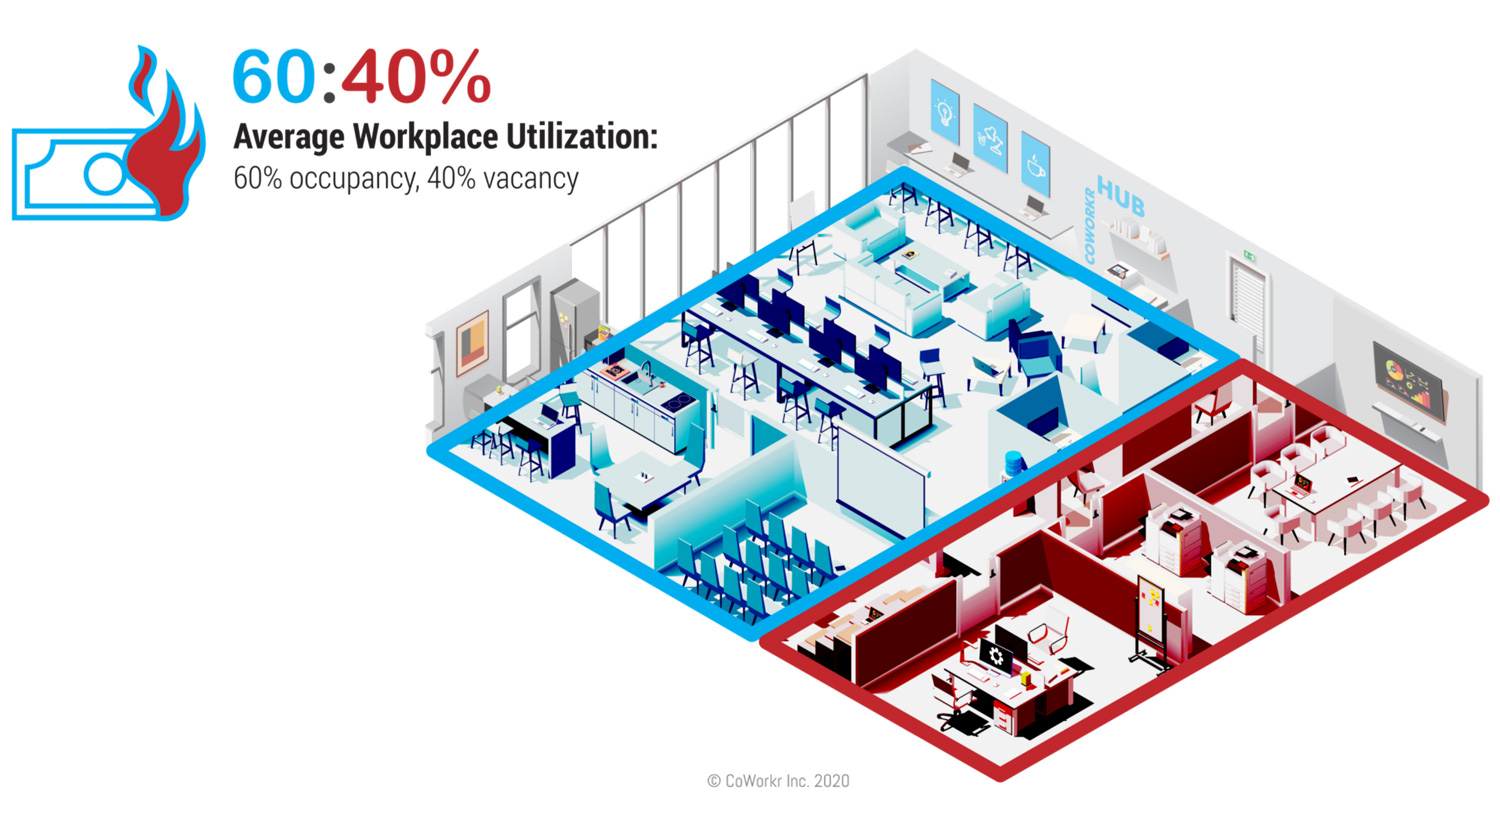
With high workspace vacancies expected, as we ease out of lockdown, and as many companies adapt to implement perpetual work-from-home policies, space utilization is expected to remain well below the sustained average utilization standard of 60% for quite some time.
Yet, by subtracting vacant spaces from the daily checklist, based on real-time daily data and interior analytics, you can give your janitorial staff the time to focus on deep cleaning and wiping down in high-risk areas, without elevating your costs.
Traditional Techniques for Understanding Daily Workspace use
One of the most common methods for understanding daily workspace usage is by aggregating badge-in counts. So, the number of times a worker swipes their badge at a secure entry point should tell you how many times that worker used the room and data from all the workers combined should tell you overall usage for different rooms.
While badge data collection is already an inherent part of building infrastructure and worker flow in many businesses, a certain level of time and expertise does have to be set aside each day to quantify this data. Furthermore, since you probably aren’t counting exits, there will be no duration dimension to the values, and the data will only be as granular as the number of entry points to a given room.
A second solution, predominantly used in retail environments with a steady in and outflow of feet, is tracking occupancy with a simple door counter that tally’s daily entries and exits.
As with badge-data collection, the granularity level of data will be set by the number of access points to space, a single access point may count the number of times that a worker enters a space but you’ll still have no idea where exactly the worker spent their time within that expansive space.
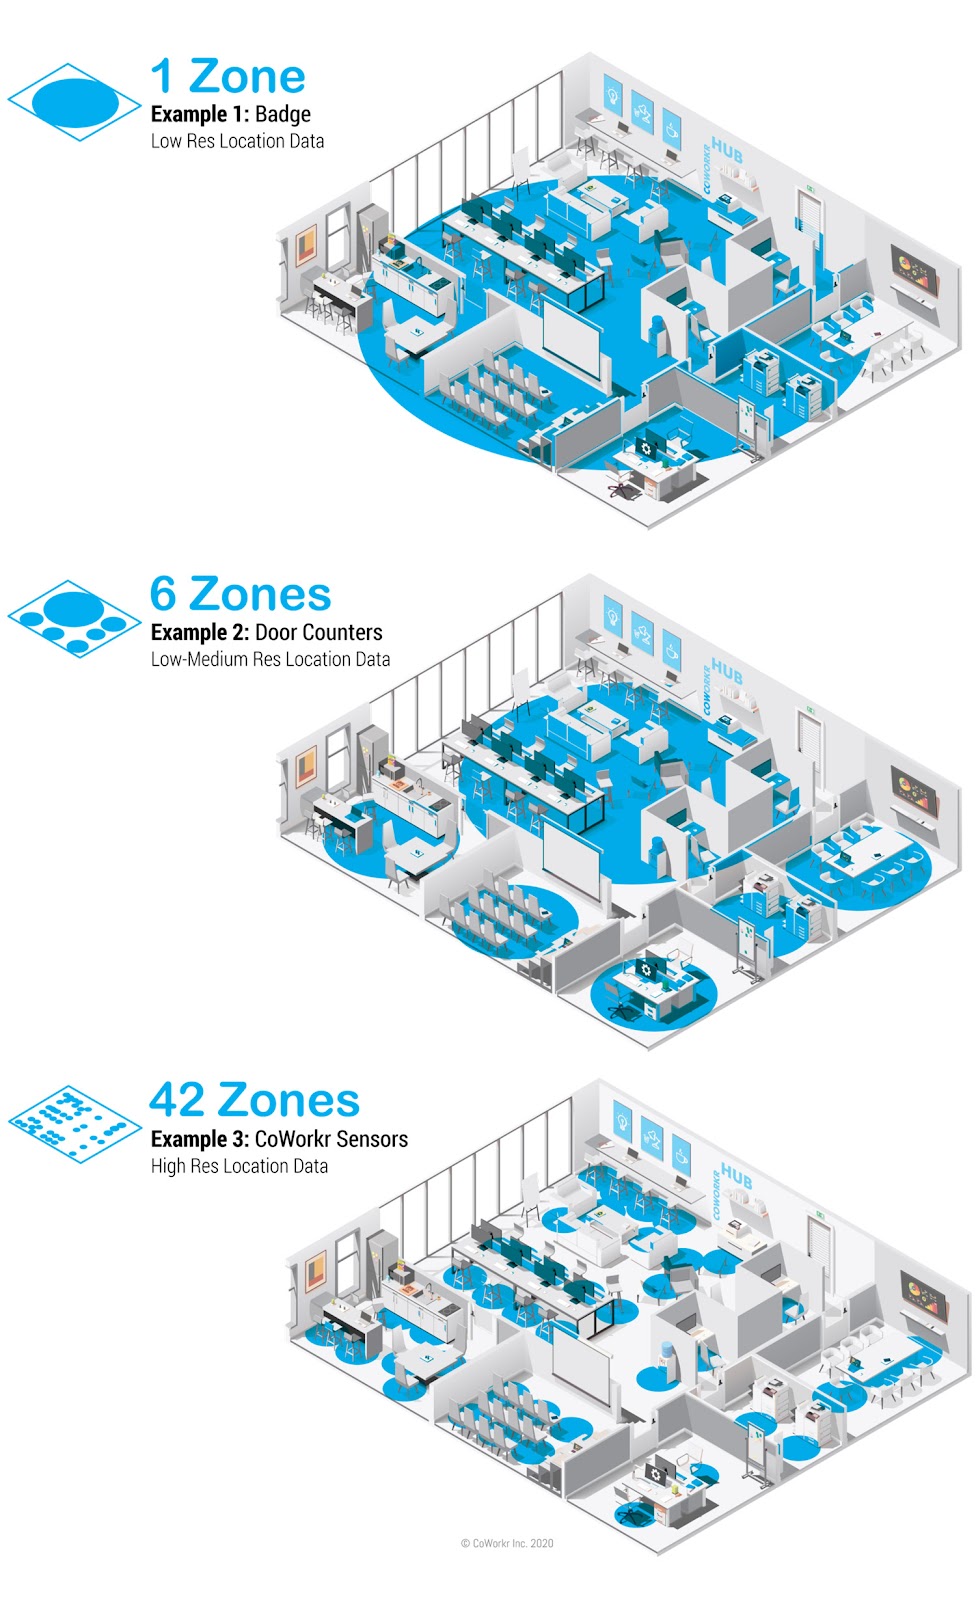
Both of these traditional methods can be considered lower-res, limiting, and inefficient in comparison with state-of-the-art solutions and tracking technology that R-Zero offers its clients.
Provisioning IoT platforms like ours, that measure a much finer granularity of space, provide an exponentially greater amount of detail when projected across an entire floor, building or company portfolio. Optimizing facility services as we are highlighting here is only one benefit.
The graphic below compares traditional badge and door data against R-Zero’s streamlined technology.
Occupancy and Location Data to Reduce Operating Costs for your Business
What if offices could be cleaned based on reliable utilization data rather than on assumption or to tick blocks on an unwavering daily checklist? How would this impact the day to day running cost of a business with thousands of square feet that aren’t seeing any daily usage?
Co-ordinating janitorial schedules around daily occupancy reports is one of the simple yet effective operation cost reduction strategies that R-Zero can help you apply during this trying time of biological risk. Since the prevalence of germs in certain high usage areas isn’t necessarily associated with any visual evidence, this data-driven approach to cleaning may also be your best option for risk-appropriate cleaning.
Daily usage data from R-Zero utilization sensors and will give you the capacity to apply resources only where needed and, in doing so, save you time and money on janitorial services. Increasing cleaning efficiencies for a 10K SF / floor, 10-level building by just a single digit percentile can mean saving or reallocating hundreds of thousands of dollars per year for your business.
R-Zero’s Sensor Technology
R-Zero provides simple, anonymous, and secure occupancy data collection through easy-to-install WorkPoint and Counter Sensor technology. WorkPoint Sensors, as the name implies, monitor individual settings, while overhead Counter Sensors count the workers within a given space.
Both sensor options collect high-resolution occupancy data, tracking space, and desk utilization down to minute and update consistently in real-time. R-Zero maintains a competitive edge as one of the only fully anonymous prop-tech solutions that allow customers to accurately track usage data at such high fidelity. By offering real-time data, workplace experience can be optimized as workers can finally find available spaces on the fly.
Detailed and actionable, R-Zero data is made readily accessible for all types of users, including those who aren’t necessarily tech-savvy. Floor plans or maps can be handed off to crews as links to the R-Zero App, PDFs, or even published on floor-by-floor digital kiosks.
How to Reduce Cost in a Business With Real-time R-Zero Data
If you’re wondering how to reduce cost in business by leveraging daily R-Zero analytics, one suggested use case runs as follows:
Using their private smartphones, company tablets, entry-point monitors, or a printed PDF, janitorial staff could refer to the last daily floor summary on arrival to a level. Industry-standard sanitation procedures could be applied to typical usage zones, with extra attention paid to areas and workstations that have seen extensive use.
Zones left unused throughout the course of a day can be overlooked during the daily cleaning routine, and spaces that see consistent vacancy can be addressed only when necessary or once a week, for example.
The floorplan sample above should give you an idea of how actual utilization data can inform your sanitation crew and facilitate a more effective and far more cost-efficient business cleaning routine.
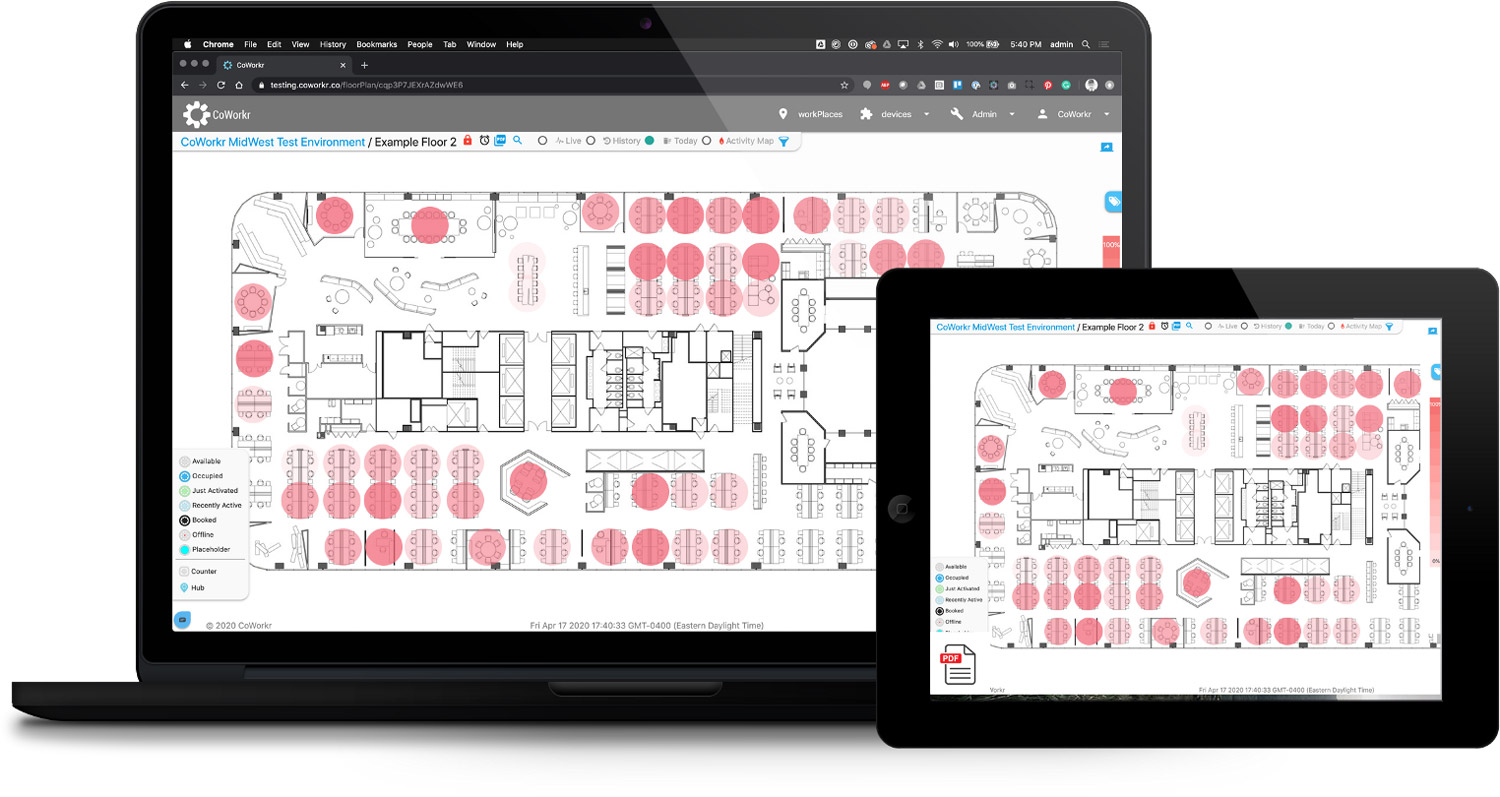 Daily Data Map for Janitorial Crew
In conclusion
To be fair, some workers are notorious for leaving spaces in a particularly disheveled state (engineers, we’re looking at you) so, bridging the gap between usage data and cleaning requirements is not always apples to apples. Still, few tools have the capacity to optimize your social distancing, cleaning schedule, and budget quite like R-Zero sensors and platforms.
With user-friendly, high-res data-driven floor plan summaries to inform their rounds each shift and unused spaces eliminated from the regular checklist, facility crews can start to apply resources where and when they’re actually needed. With a wealth of experience driving business cost-saving strategies through quality data and analytics, we are ready to help you balance the tipping scale.
More posts you might like
-

2022 Benchmark Data. Who Is Measuring What?
Hello Friends, Who ended 2022 where you thought you would? Well, many of our customers did not and some ended the year finding themselves in the middle of surprising new trends. We’d like to share with you some of our 2022 sensor-based Utilization Benchmark Data. If you are curious about any of these key findings, […]
-

Right-Sizing your Portfolio with Peak Metrics
A new way of working is here to stay. What started as a pandemic-era necessity has rapidly become the norm in many industries, including many fortune 500 companies and global corporations. Studies have shown that 73% percent of employees say they need a better reason to go into the office than just company expectations. It’s […]
-
Top 8 Essential Office Space Utilization Metrics & Their Applications
One thing we know for sure is that the future is uncertain. Instead of being stuck in a daze of wonder, real estate professionals are grounding their planning processes in data. So long as they have data to guide them, they can plan for hybrid work environments that are bound to change over time. Fortune […]